Data Orchestration for AI targets the operational bottleneck of modern data lakes: abundant datasets exist, but they are hard to trust and expensive to use. Data is scattered across sources, weakly documented, inconsistently formatted, frequently duplicated, and continuously changing. In practice, the information to retrieve and compose is often heterogeneous across structured and unstructured forms. It can span large collections of tables and multi-table relationships (VLDBJ’25), temporal data such as time series (VLDB’25), and settings where the query may be expressed as natural language, tables, or visual charts (ICDE’25). These conditions make it difficult to reliably obtain the right evidence for model training and analytical reasoning, especially when the data must be composed across multiple tables or modalities.
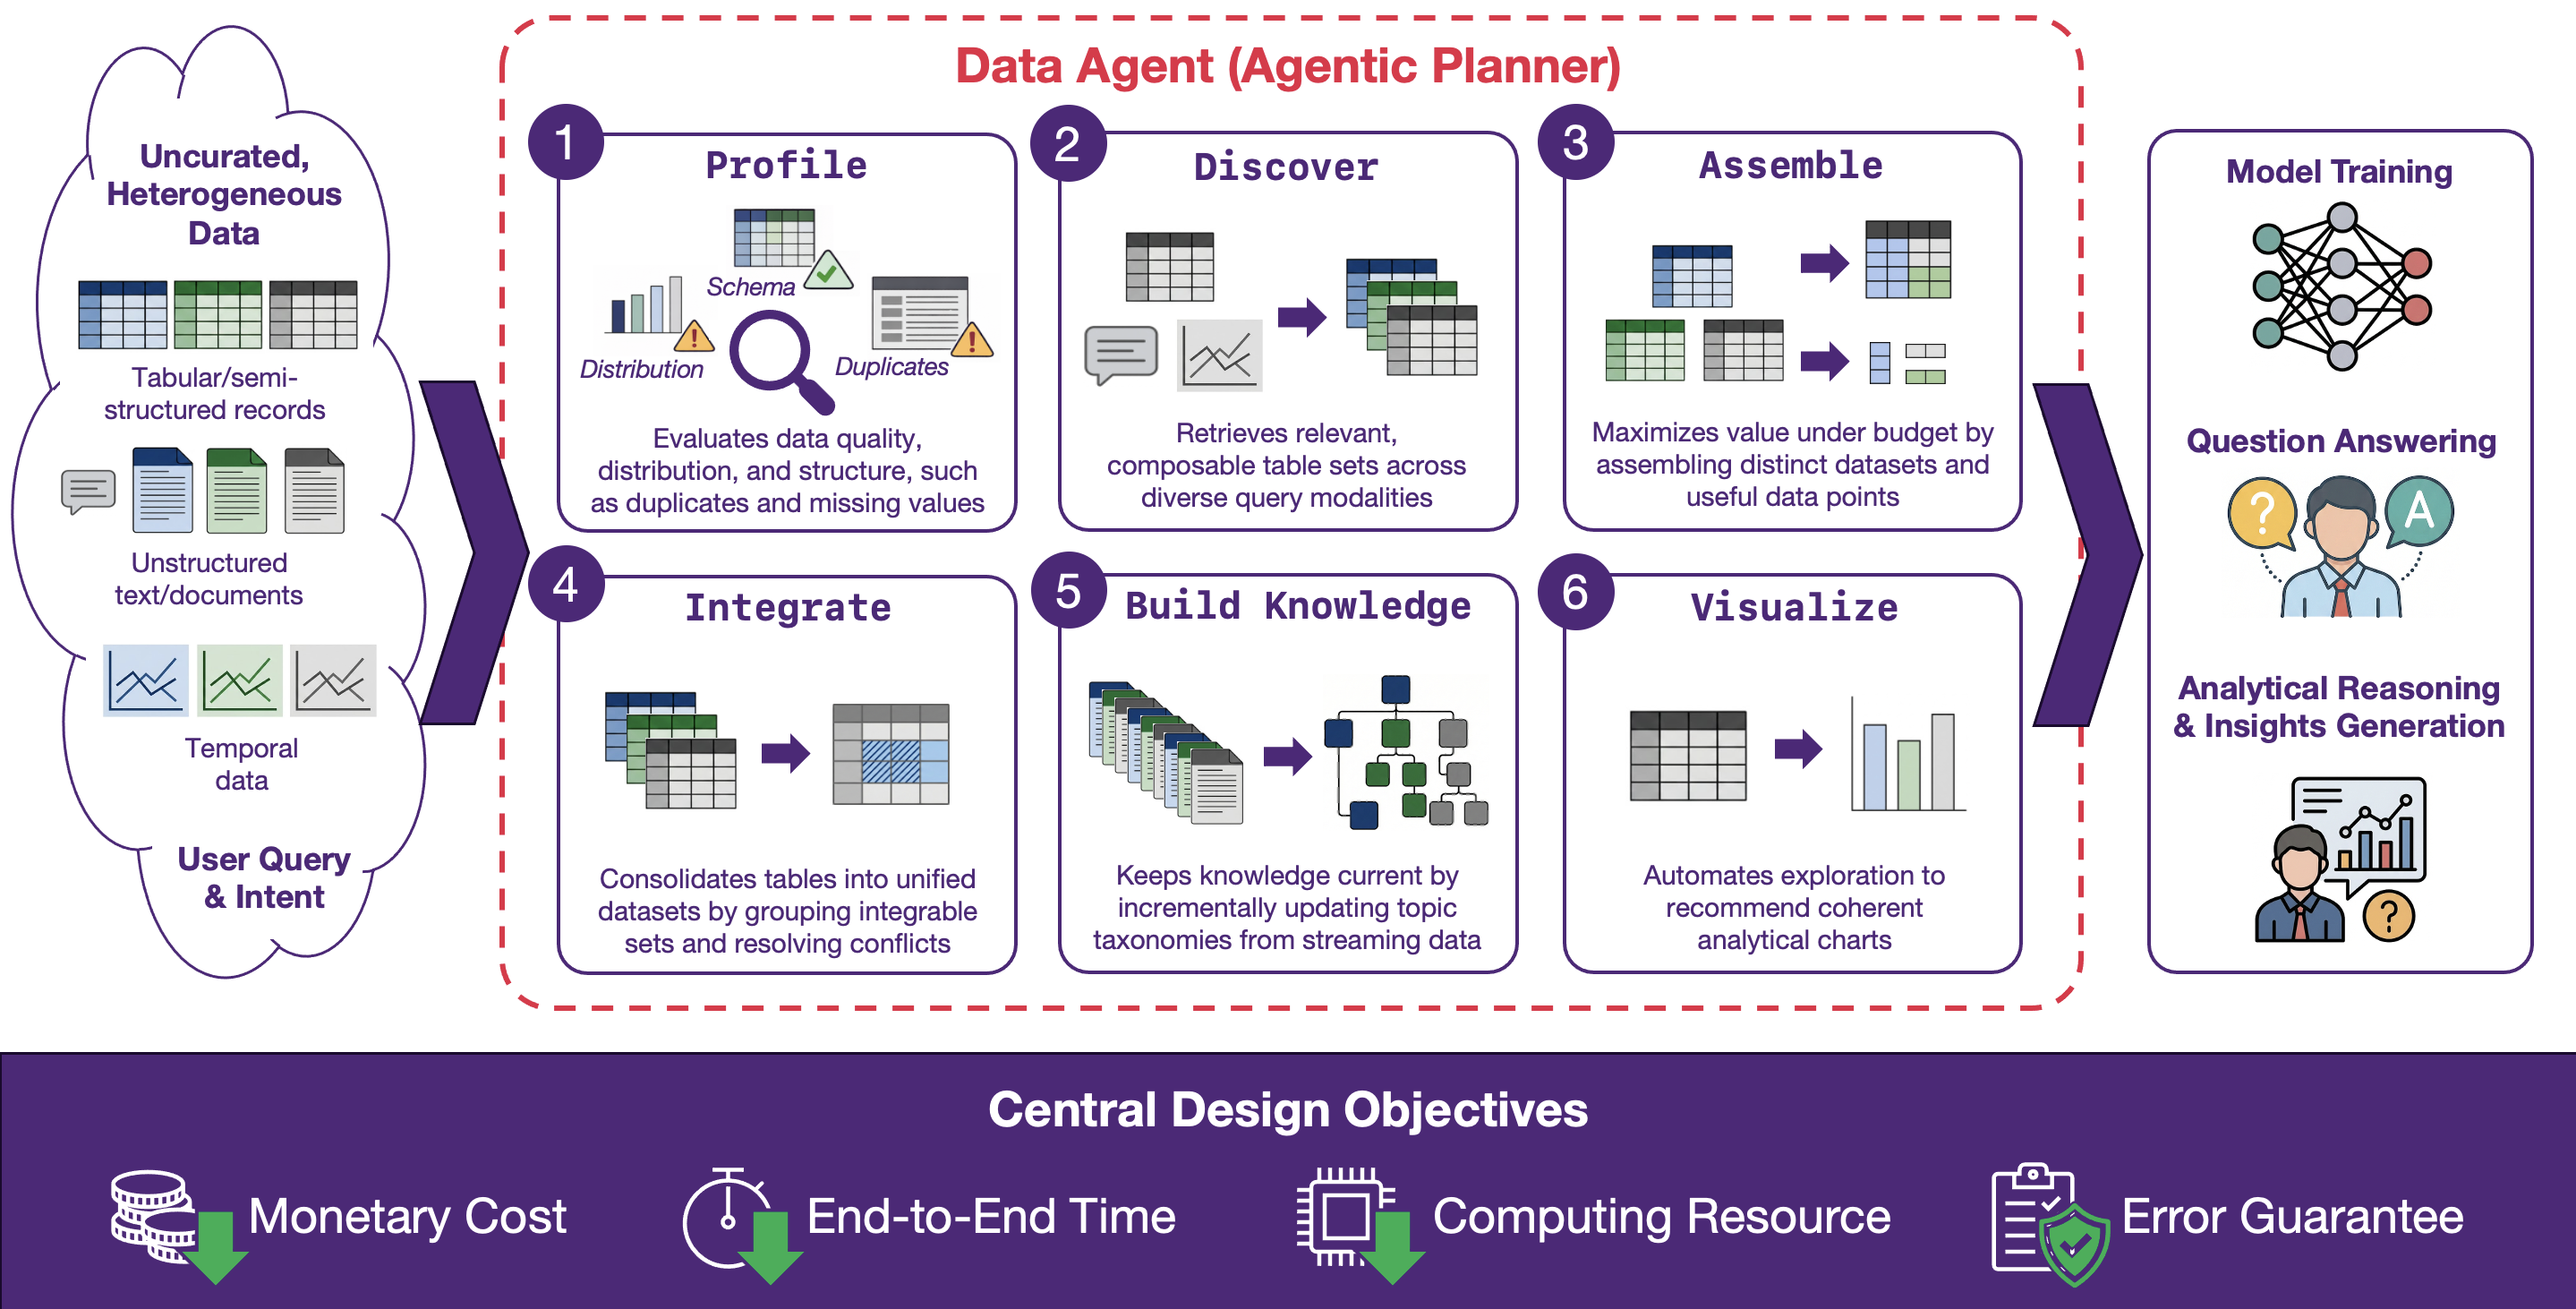
The orchestration pipeline imposes structure through a sequence of capability-driven steps. It profiles raw assets to expose schema, distributions, and quality signals. It then discovers and retrieves relevant evidence across user intents and query modalities, including composable multi-table sets. Next, it assembles datasets and data points under explicit budgets to maximize distinct and useful information (WWW’25, VLDB’24). It integrates and consolidates related sources, resolves conflicts (VLDBJ’25), and repairs data gaps such as missing or inconsistent values (VLDBJ’26). Finally, it builds and maintains organizational knowledge (e.g., taxonomies and relationship structures) and visualizes provenance, decisions, and outcomes so users can inspect and intervene.
Across these stages, the central design objective is performance and robustness under constraints. Orchestration should optimize for monetary cost, end-to-end time, serving latency, and computing resources, favoring lightweight operators when possible and escalating to heavier reasoning only when justified by value. It should be resilient to distribution shift and noisy inputs, and it should provide actionable reliability signals, such as confidence estimates, error bounds, and budget-aware guarantees that the pipeline remains predictable at scale.
Topic 1: Agentic Data Orchestration for Scholarly Corpora
1.1) AgenticScholar: Agentic Data Management with Pipeline Orchestration for Scholarly Corpora (SIGMOD’26) (System Prototype)
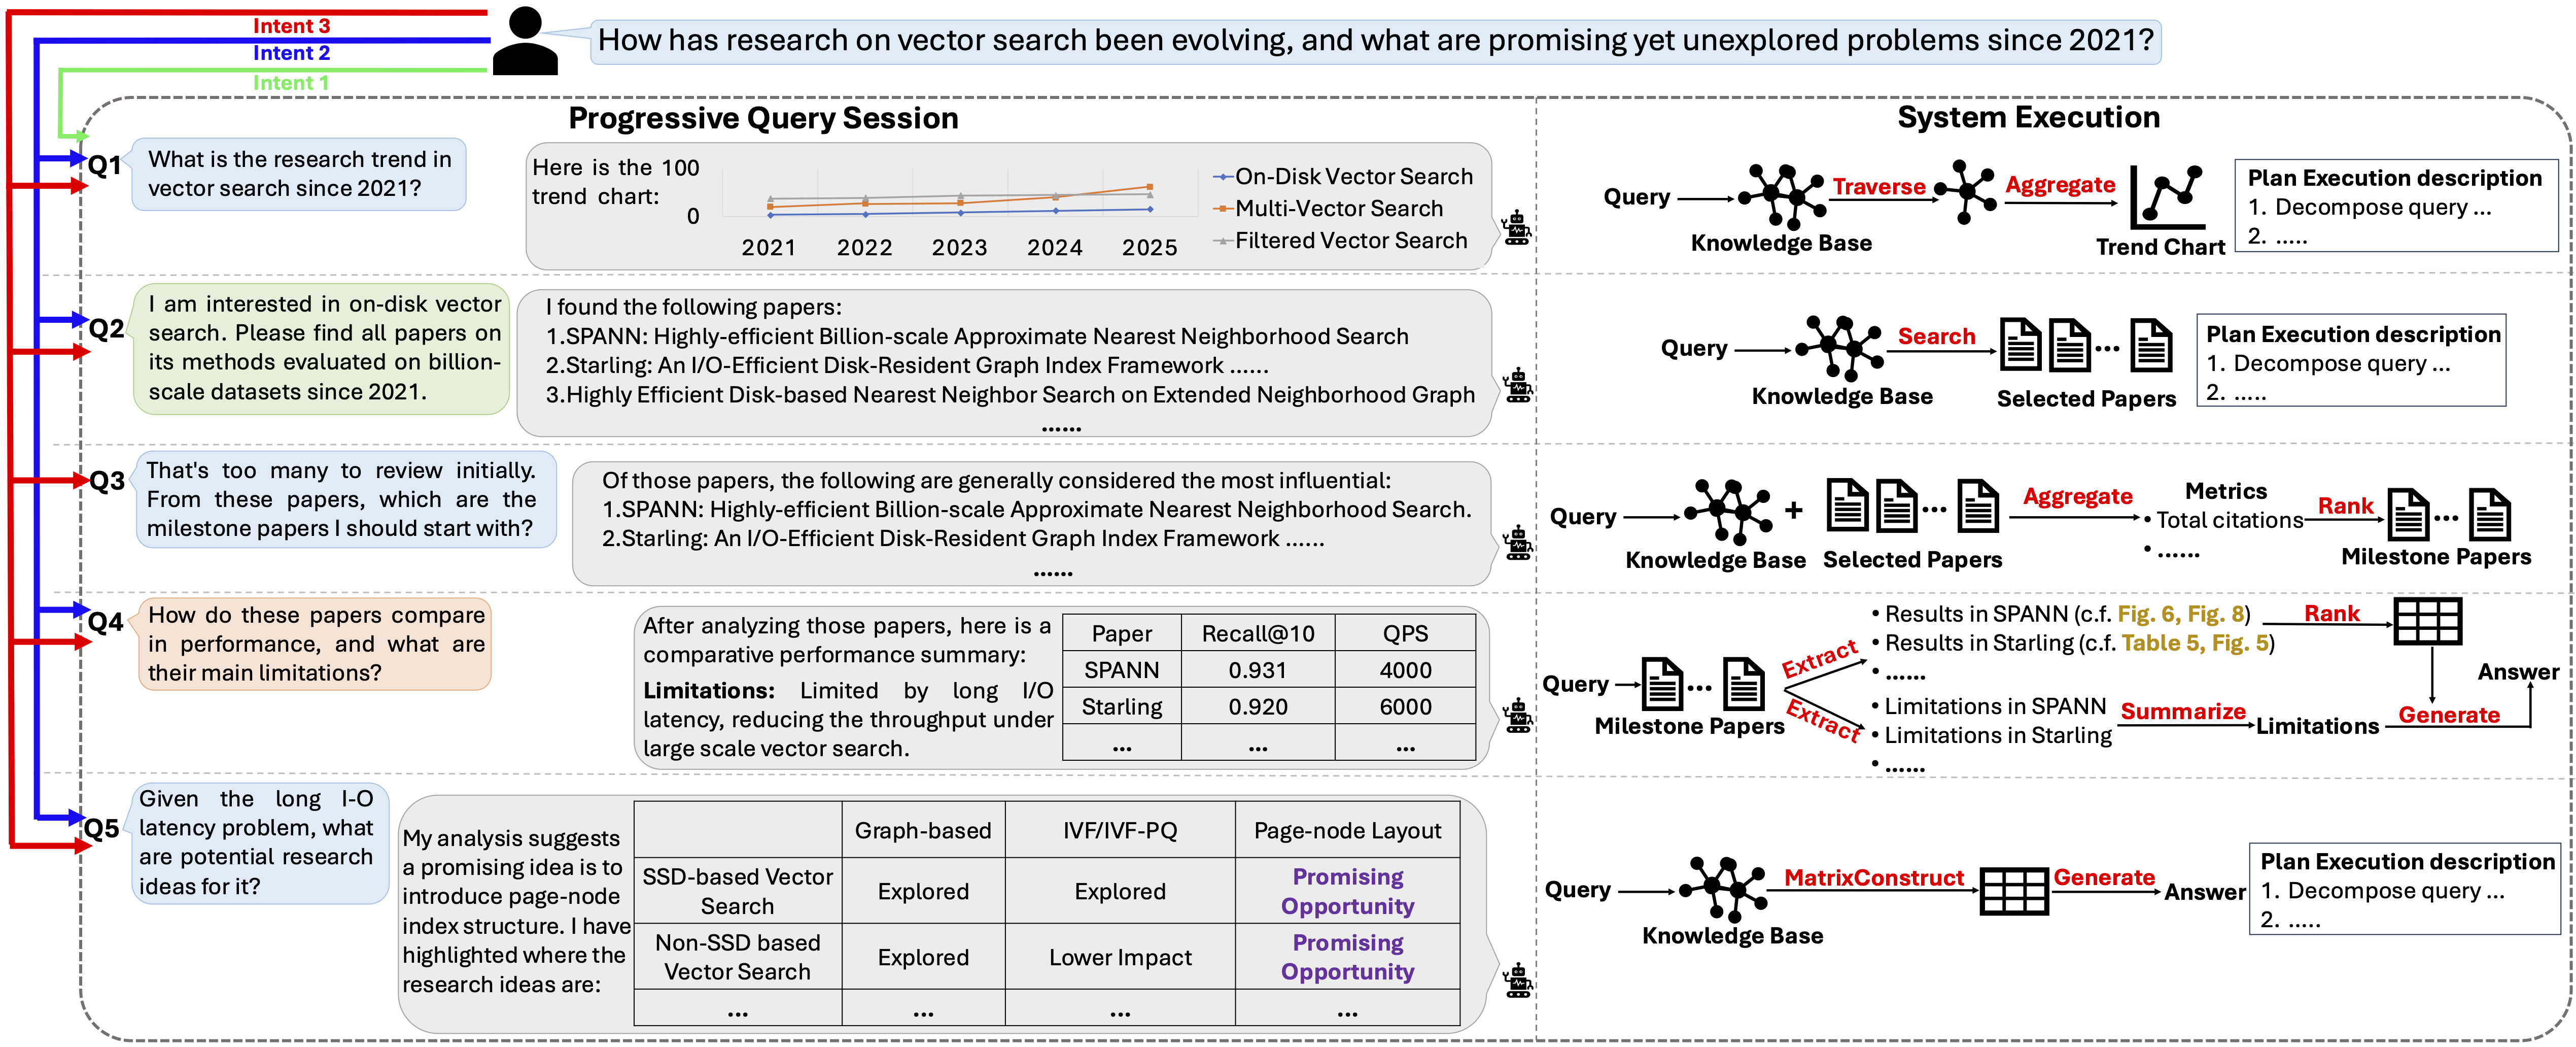
AgenticScholar addresses the growing friction in scholarly analysis, where evidence is distributed across modalities such as text, tables, figures, code snippets, and citation and bibliographic context, and where questions naturally evolve from retrieval into multi-step synthesis, comparison, trend tracing, and idea exploration. It treats this interaction as compiling natural-language requests into evidence-grounded analysis workflows represented as explicit executable DAG plans, rather than isolated invocations of a retriever or summarizer. In practice, it supports a spectrum of scholarly queries, including constraint-based paper retrieval; single-paper extraction and structured summarization of problem, method, and experimental details; cross-paper synthesis with ranking and inconsistency checking; and higher-level knowledge discovery such as research trend analysis, milestone paper selection, and uncovering under-explored problem–method combinations. Its agentic core unifies a structure-aware, multi-modal scholarly knowledge base with hybrid planning and operator-based execution, while keeping the process inspectable via materialized plans, intermediate results, and data lineage, and supporting new workflows by composing and extending a library of reusable operators.
Topic 2: Heterogeneous Data Lake Management and Governance
2.1) Table Integration in Data Lakes Unleashed: Pairwise Integrability Judgment, Integrable Set Discovery, and Multi-Tuple Conflict Resolution (VLDBJ’25) (System Prototype)
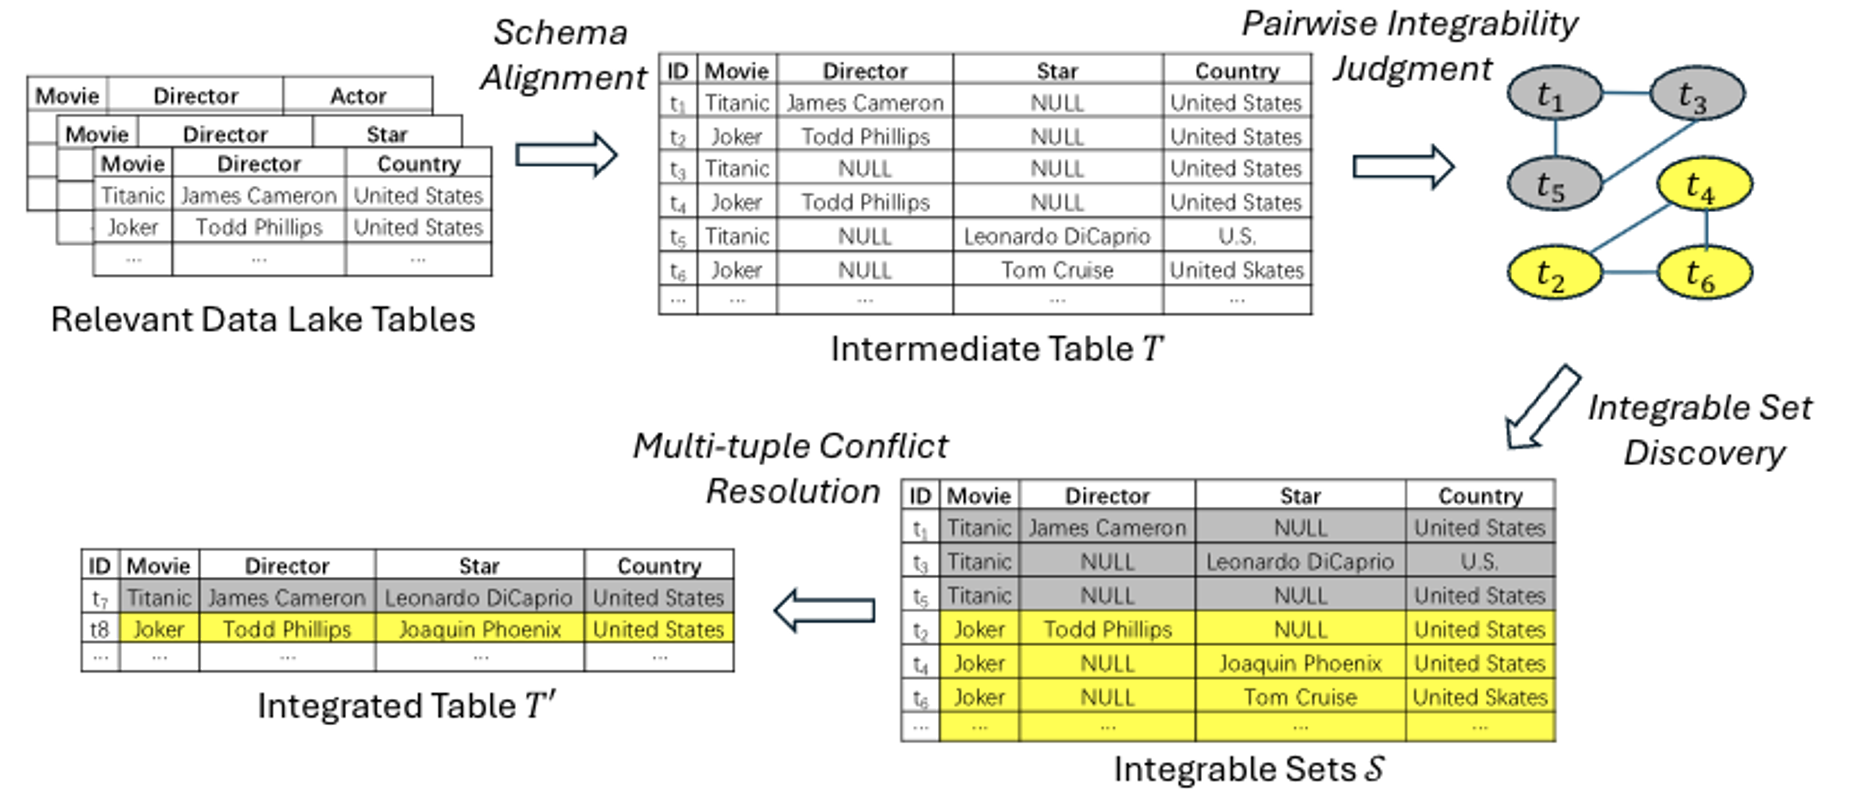
Data lakes store large amounts of raw tables collected from many independent sources, which makes them a rich place to look for data you need. However, these tables are rarely cleaned or standardized: the same fact may be written in different ways (e.g., abbreviations vs. full names), contain typos, or appear with missing and contradictory values. This paper studies data-lake table integration—automatically combining multiple related tables into one unified, more complete table that consolidates all relevant information. Concretely, the paper focuses on three practical sub-problems: (1) deciding whether two rows should be merged even if they differ due to semantic paraphrases or typographical errors (pairwise integrability judgment), (2) grouping all rows that belong together into “integrable sets” (integrable set discovery), and (3) resolving attribute conflicts when multiple rows disagree (e.g., picking the correct value among candidates) (multi-tuple conflict resolution). A key advantage is that the proposed pipeline is designed for label-scarce settings: it learns to judge mergeable row pairs largely through self-supervision (by generating realistic “noisy but equivalent” training examples), and it resolves conflicts using in-context learning with large language models, which can work with only a small number of demonstration examples.
2.2) Scalable Structure-aware Table Retrieval in Data Lakes (under review) (WWW’25 Demo)
Data lakes contain large, heterogeneous collections of tables that support downstream tasks such as data integration, analytics, and feature construction. In these settings, useful evidence rarely comes from a single table in isolation: practitioners typically need a connectable set of tables that can be combined through join and/or union operations, sometimes requiring multi-hop connections through intermediate tables. However, most existing table retrieval methods rank tables independently, which can yield top results that are individually relevant yet mutually incompatible—limiting their utility for composition-centric tasks. We study connected table set retrieval in data lakes: given a natural-language query, retrieve a small set of tables that is both relevant to the query and connected directly or indirectly via join/union relationships. To address this problem, we propose SSAM, a novel retrieval framework with two key properties: (1) structure-awareness, which explicitly models join/union connectivity to retrieve composable table sets rather than isolated tables; and (2) scalability, which avoids exhaustive enumeration by pruning the combinatorial search space and efficiently identifying promising starting points and connection paths. Intuitively, searching for connected tables that satisfy a data need is NP-hard due to the exponential number of possible table combinations. SSAM tackles this challenge by casting the data lake as a relationship graph and performing constrained, pruned search to return high-quality connected table sets at data-lake scale.
2.3) Unified Data Discovery across Query Modalities and User Intents (under review)
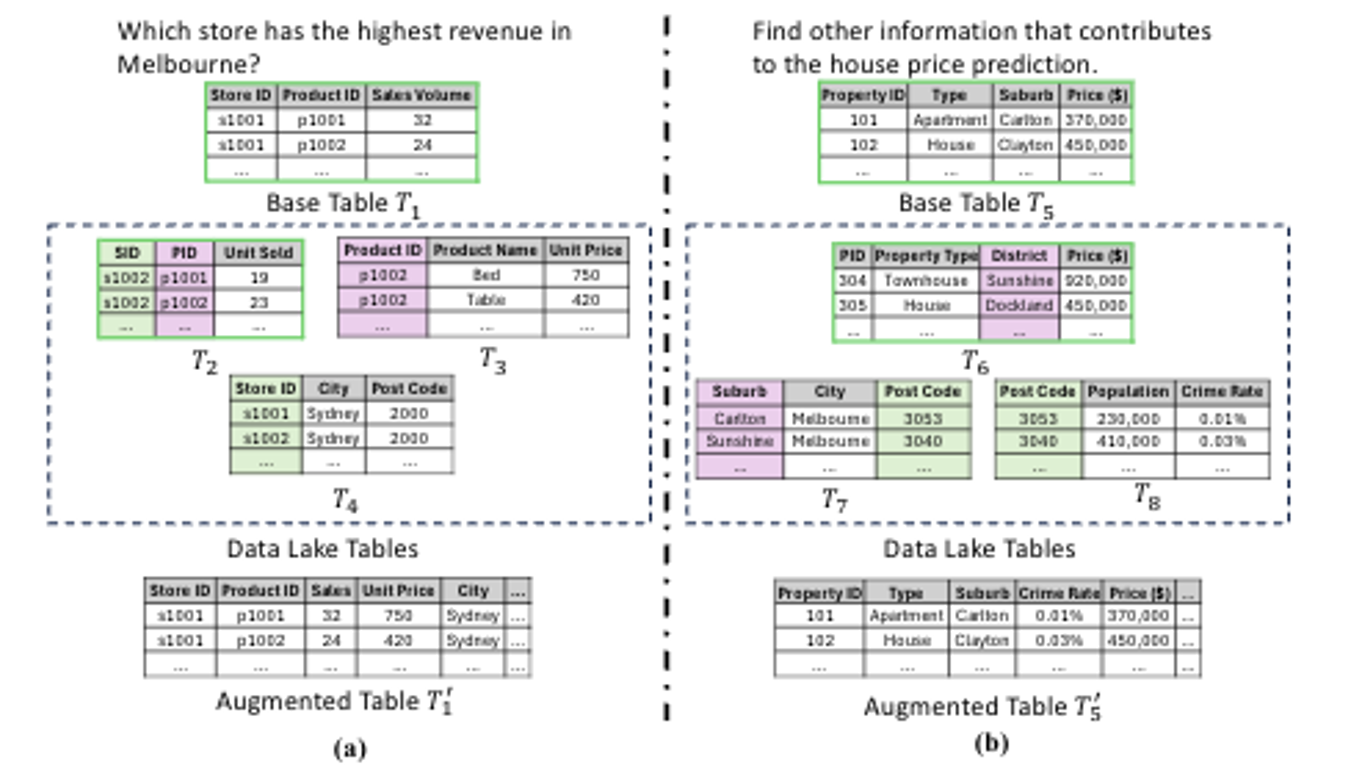
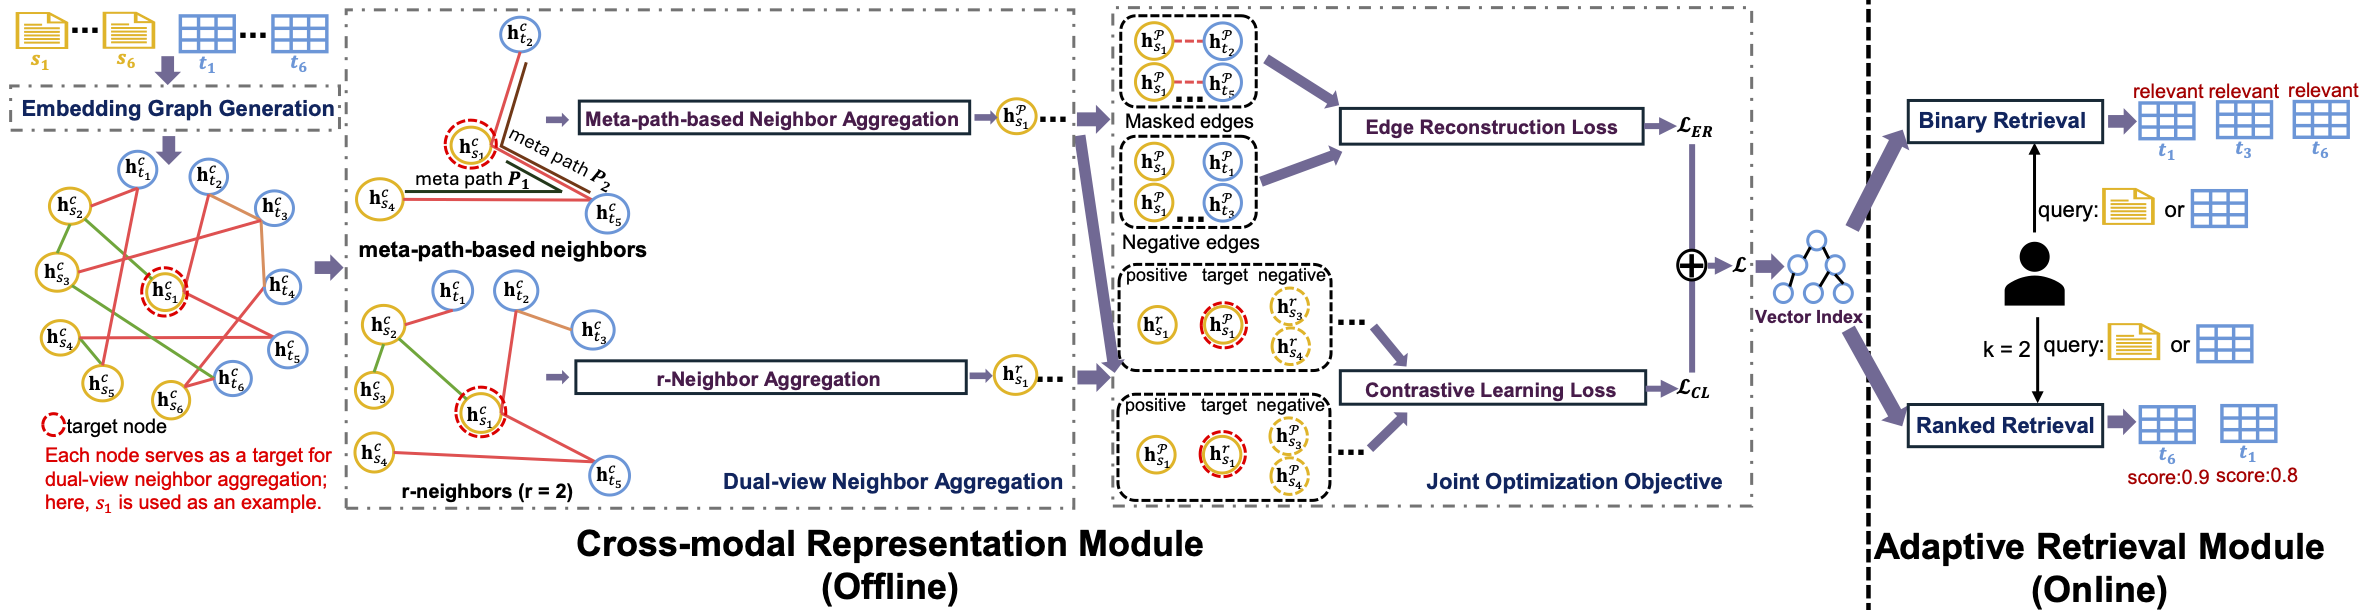
Modern data lakes support diverse applications such as question answering and fact verification, yet existing data discovery methods are typically designed for a single query modality or specific user intent. This work studies how to uniformly retrieve relevant tables given either natural language statements or tables as queries, without relying on intent-specific modeling. To this end, a unified cross-modal graph learning framework is introduced to learn shared representations for queries and tables by leveraging heterogeneous contextual signals in data lakes under limited supervision, enabling flexible and scalable relevance assessment.
Topic 3: Dataset Discovery from Visualization Charts
3.1) Dataset Discovery via Line Charts (ICDE’25) (VLDB’24 Demo)
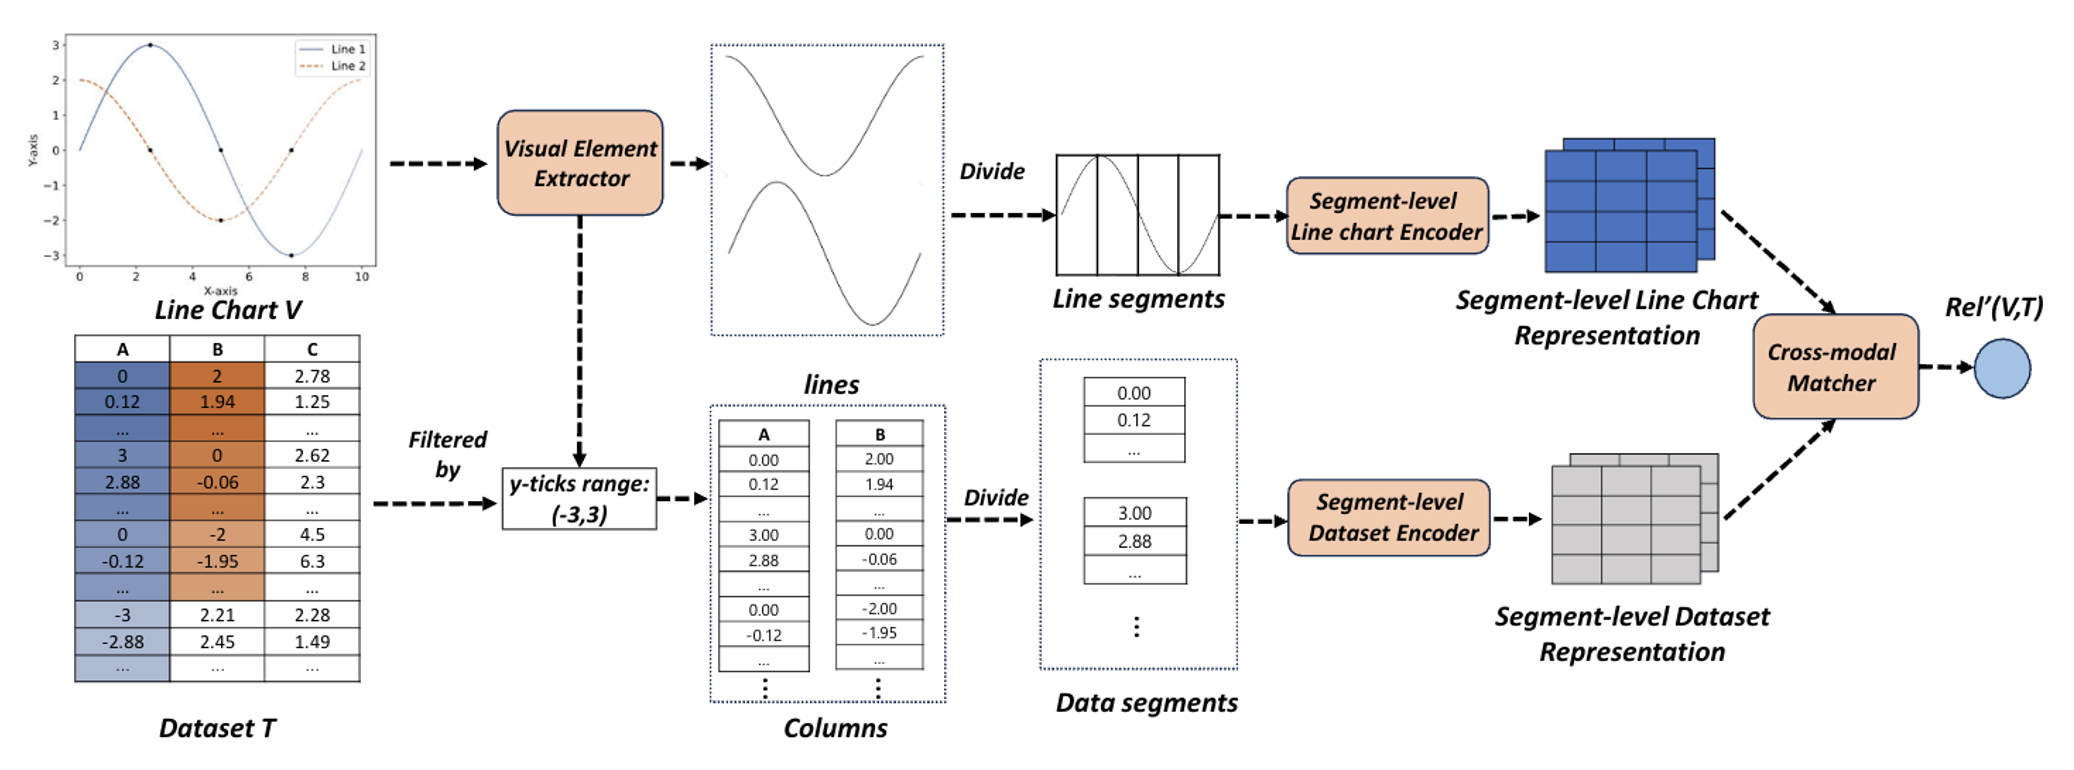
Line charts are everywhere—from news articles to dashboards—because they make it easy to communicate how something changes over time. But there’s a common frustration: you may find an interesting line chart online while the underlying dataset is missing or not shared, making it hard to reproduce the figure, verify claims, or run further analysis. This work introduces a new dataset discovery problem: dataset discovery via line charts. The idea is simple: given a line chart as the query, the system searches a large collection of tabular datasets (e.g., a data lake) and retrieves the tables that could generate a similar chart. This is challenging because it is a cross-modal matching task—connecting information expressed visually (lines, shapes, trends) with information stored in tables (columns, values, time fields), often without explicit metadata linking the two. To solve this, the paper proposes a Fine-grained Cross-modal Relevance Learning Model (FCM) with two key desirable properties: (1) it supports fine-grained matching at both the segment level and the line-to-column level, enabling accurate retrieval for multi-line charts; and (2) it remains effective when the chart is produced using common aggregation operations (e.g., sum, avg, max, min), allowing it to retrieve the underlying tabular datasets even when the plotted values are aggregated rather than raw.
Topic 4: Evidence-Grounded Knowledge Building
4.1) Taxonomy Maintenance In The Wild Over Evolving Scholarly Data: Reliability, Efficiency, and Cost-Effectiveness (under review)
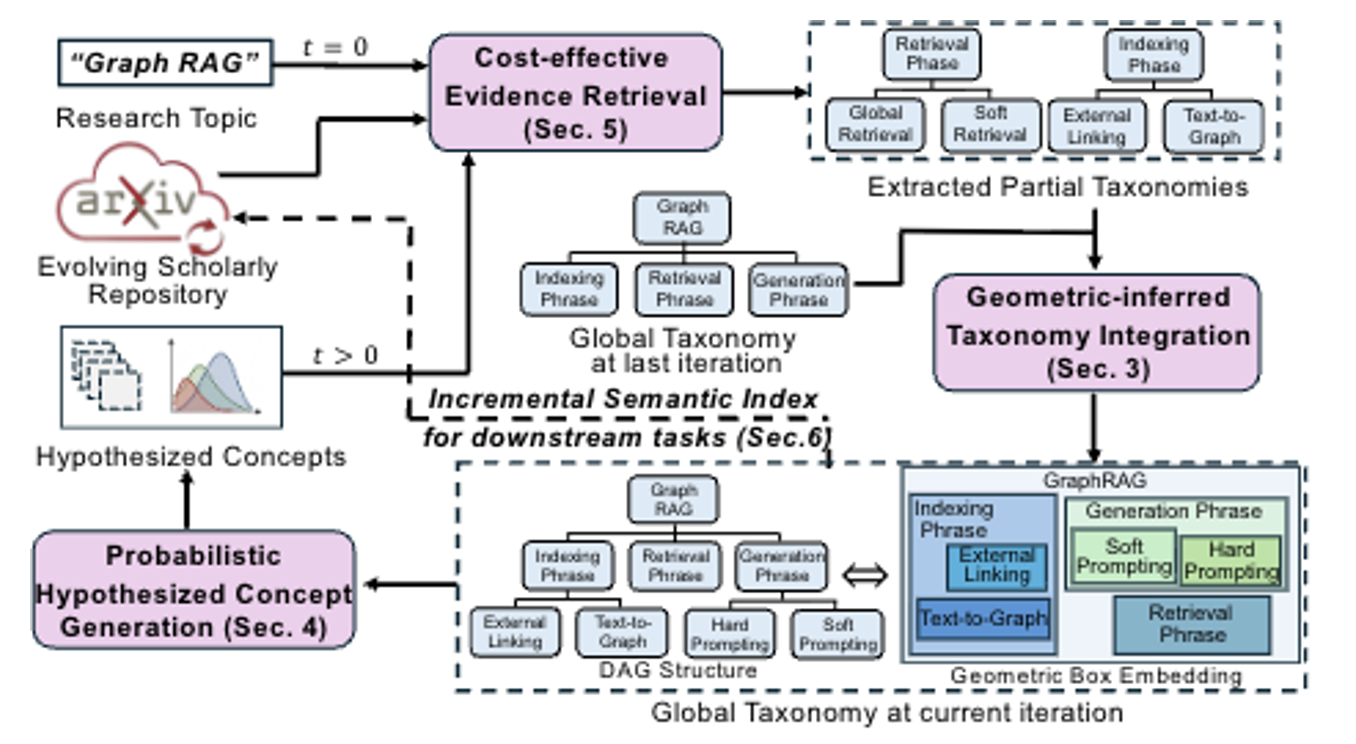
Taxonomy is a structured “topic map” that organizes concepts into a hierarchy (e.g., Machine Learning → Deep Learning → Graph Neural Networks), helping people and systems navigate, search, and reason about a domain. However, modern research fields evolve so quickly that any hand-crafted taxonomy can become outdated within months. This paper studies taxonomy maintenance in the wild: continuously updating a topic taxonomy as new papers stream into open repositories such as arXiv, where terminology shifts, subareas split into finer themes, and higher-level categories must be reorganized over time. To address this challenge, the paper proposes GIST, a taxonomy maintenance framework with three desirable properties: 1) Robust. Instead of asking an LLM to directly “invent” taxonomy structure, GIST grounds updates in author-written evidence by extracting small, reliable topic hierarchies from papers’ Related Work sections. 2) Scalable. GIST supports continual updates through incremental learning, using a novelty-aware coreset (a compact, representative memory of past evidence) to avoid expensive full retraining over all historical papers. 3) Cost-effective. GIST operates under a user-specified token budget: a budget-aware planner decides what to retrieve and which papers to parse so that only the most informative evidence is processed at each update.
Topic 5: Dataset and Data Point Assemblage
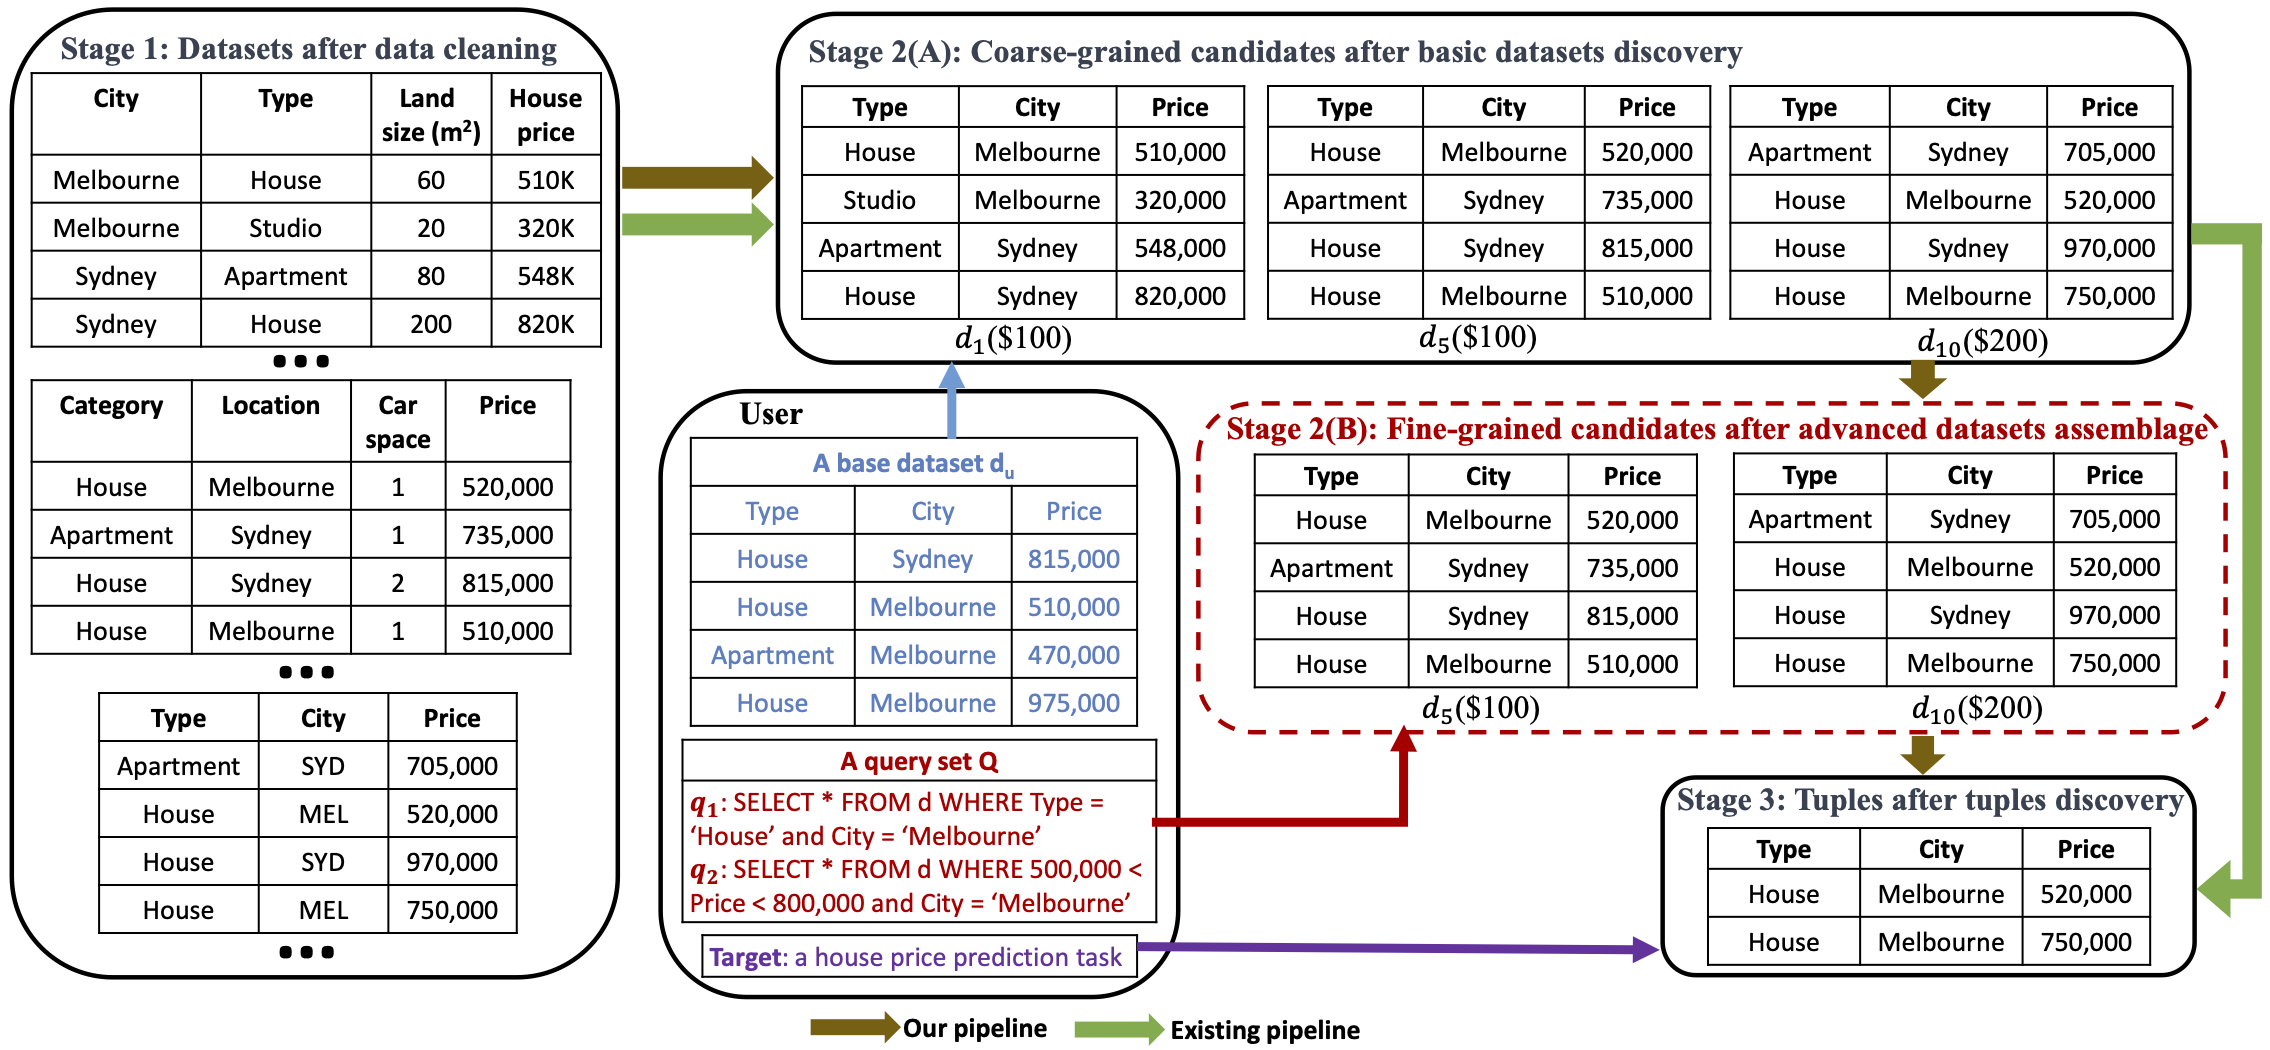
5.1) Distinctiveness Maximization in Datasets Assemblage (WWW’25) (System Prototype)
Modern data lakes offer abundant datasets, yet existing discovery methods typically evaluate datasets individually, leading to redundant acquisitions and inefficient budget usage. This work studies how to assemble a set of datasets under a budget to maximize the amount of distinct information with respect to a query set. We formulate this as a distinctiveness maximization problem and develop an efficient ML-based method to estimate dataset distinctiveness, enabling scalable greedy selection without expensive exact computation.
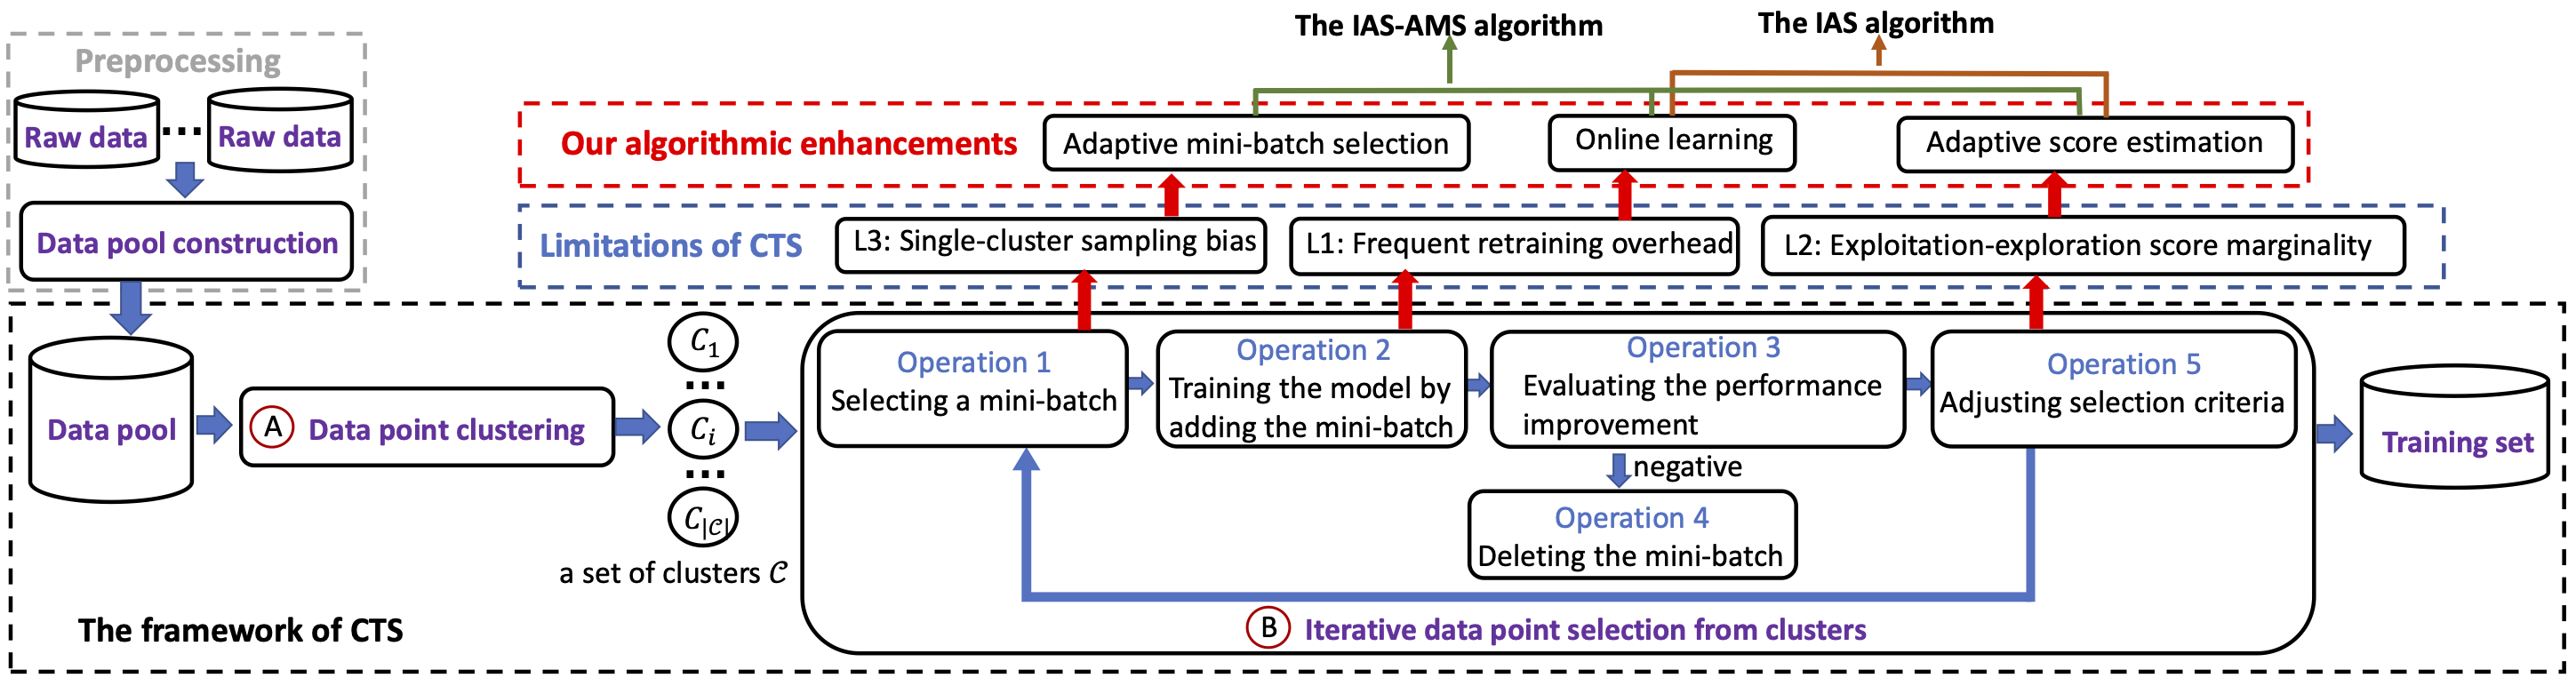
5.2) Optimizing Data Acquisition to Enhance Machine Learning Performance (VLDB’24) (System Prototype)
Modern machine learning models depend heavily on training data quality, yet simply collecting more data does not guarantee better performance. This work studies how to select high-quality labeled data from large, heterogeneous data pools to improve a target ML model. Since validating data value typically requires repeated retraining during selection, which is computationally expensive, we develop adaptive, model-agnostic algorithms that combine online learning with dynamic exploration-exploitation scoring to efficiently estimate data utility without full retraining.
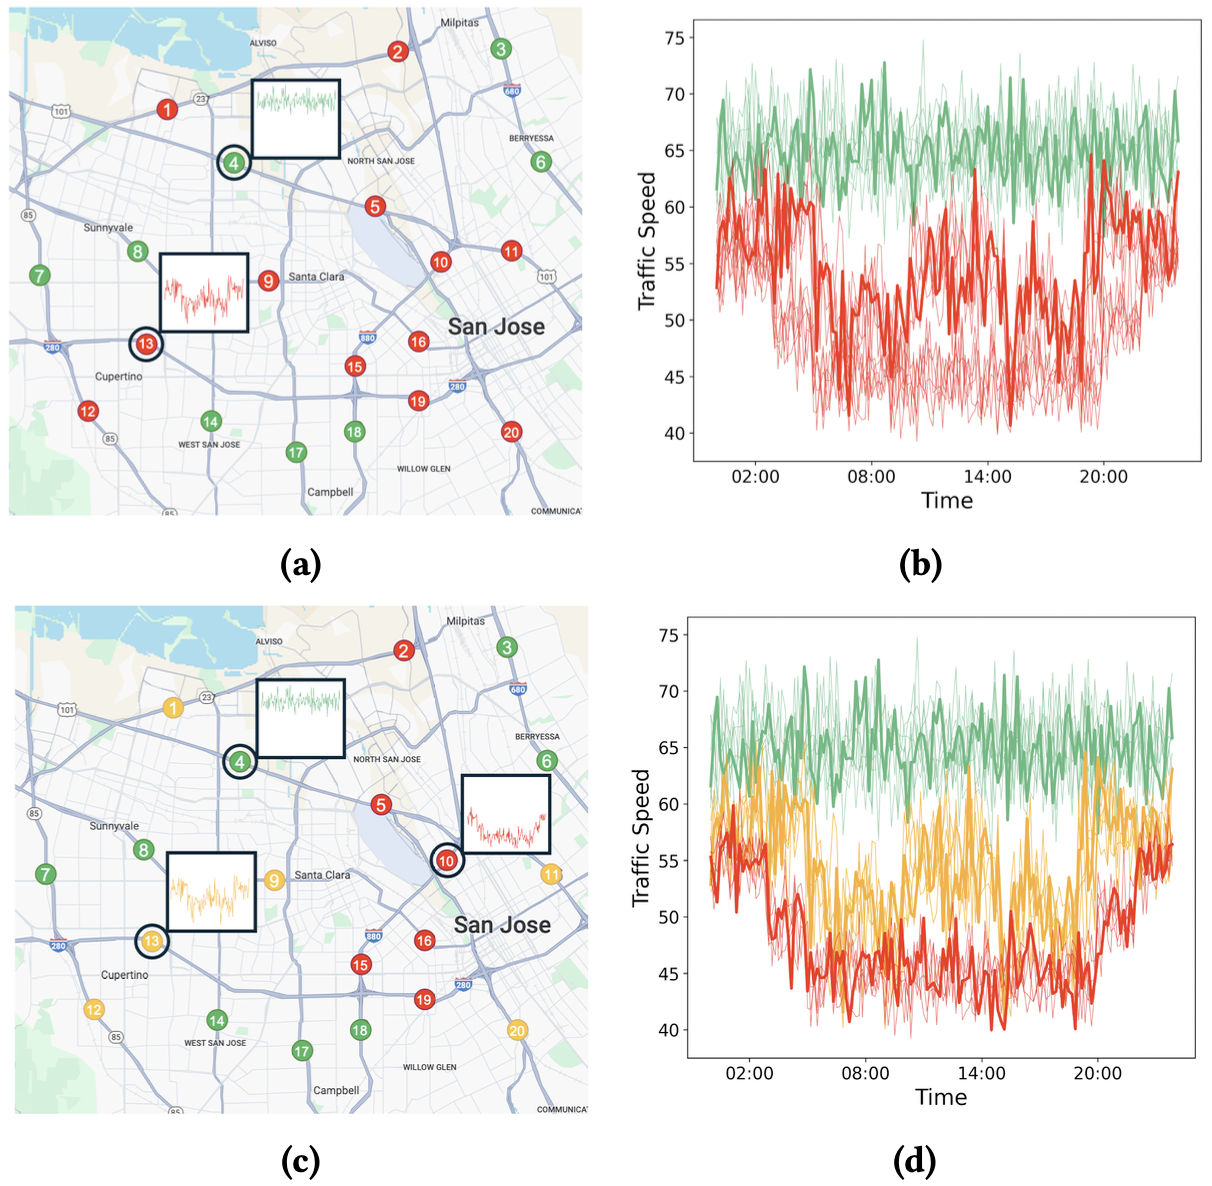
5.3) Representative Time Series Discovery for Data Exploration (VLDB’25) (System Prototype)
This work tackles the challenge of making massive time series collections easier to explore and summarize by extracting a compact set of representative series that preserve the dataset’s key patterns for exploratory analysis. It formalizes representativeness through a user-specified similarity threshold and asks for the smallest set of time series whose represented neighborhoods collectively cover a target fraction of the dataset. This framing offers intuitive control over how strict representativeness should be while avoiding redundant selections, and the paper establishes the problem’s computational difficulty while providing practical strategies with provable guarantees that make representative discovery feasible at scale under tight time and memory budgets.
Topic 6: Duplicate Detection
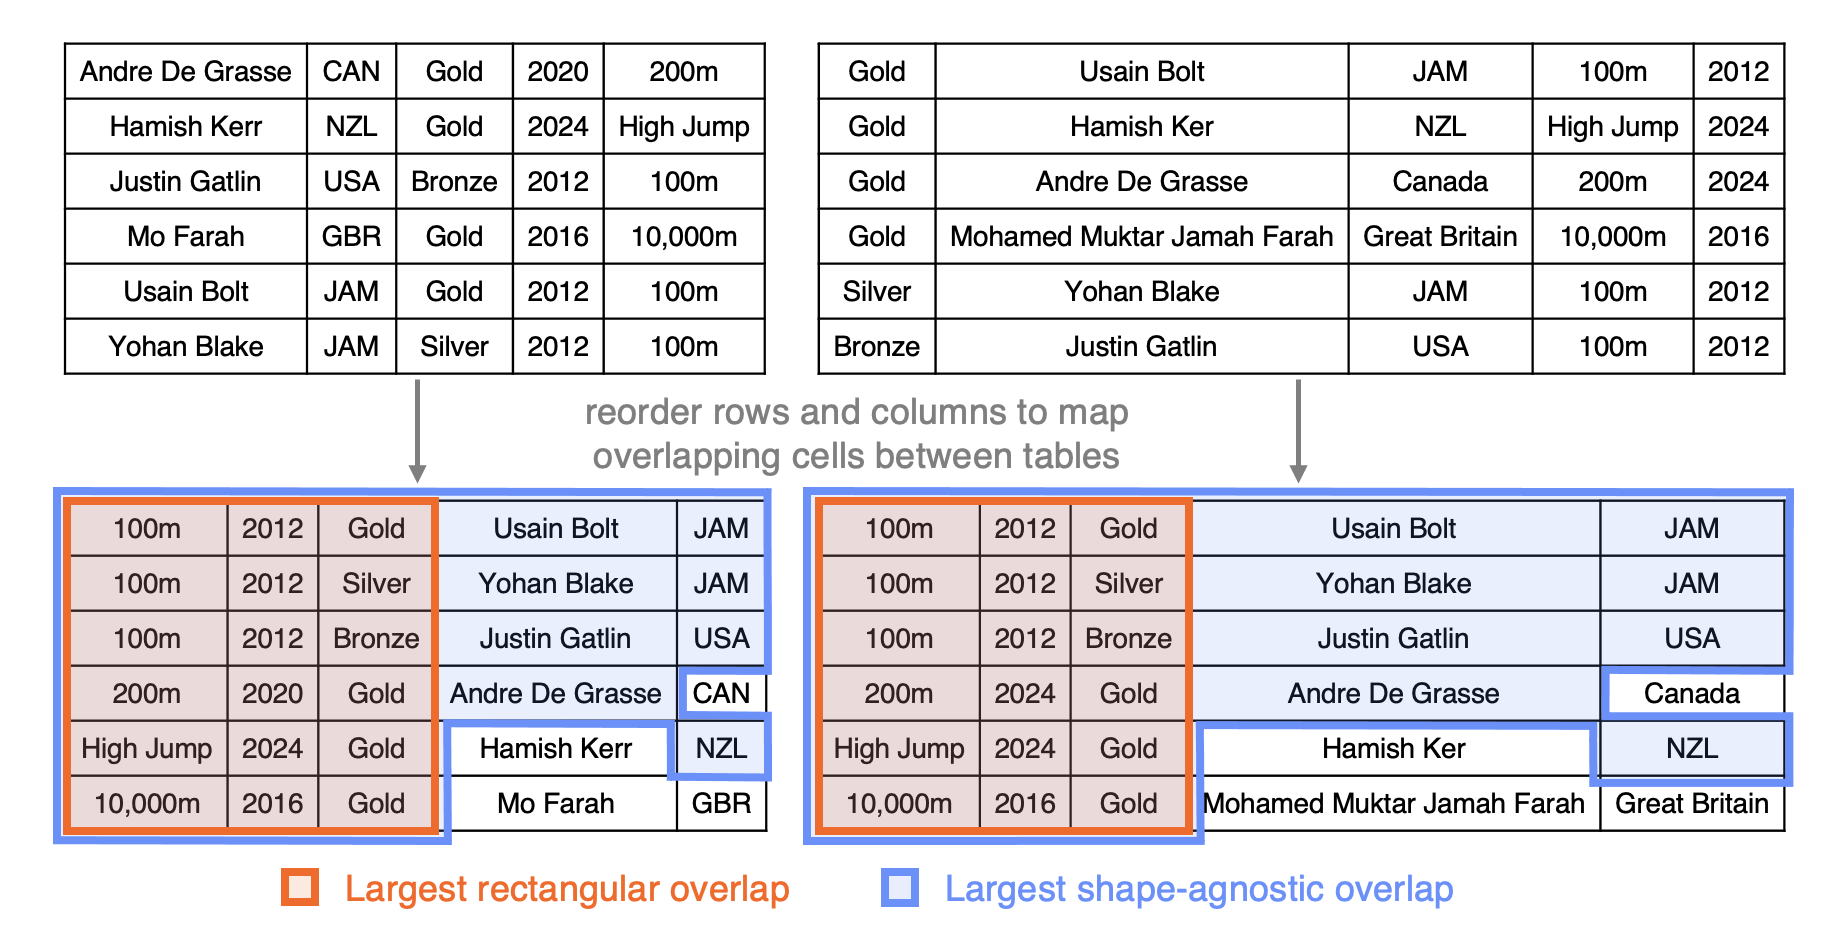
6.1) Shape-Agnostic Table Overlap Discovery: A Maximum Common Subhypergraph Approach (SIGMOD’26) (System Prototype)
Shape-Agnostic Table Overlap Discovery addresses a common gap in real table repositories: two tables can represent nearly the same information, yet differences in row/column order, missing or inconsistent headers, and partial edits can obscure which cells truly correspond. It introduces a shape-agnostic notion of overlap that seeks the largest set of exactly matching cells recoverable under a single globally consistent row/column reordering. This recovers larger shared content that can be scattered and non-rectangular, rather than being limited to what any single contiguous rectangular block can capture. By enabling faithful reconstruction of shared cells without relying on metadata, it directly supports practical workflows such as cross-source copy detection, data deduplication, and table version comparison.
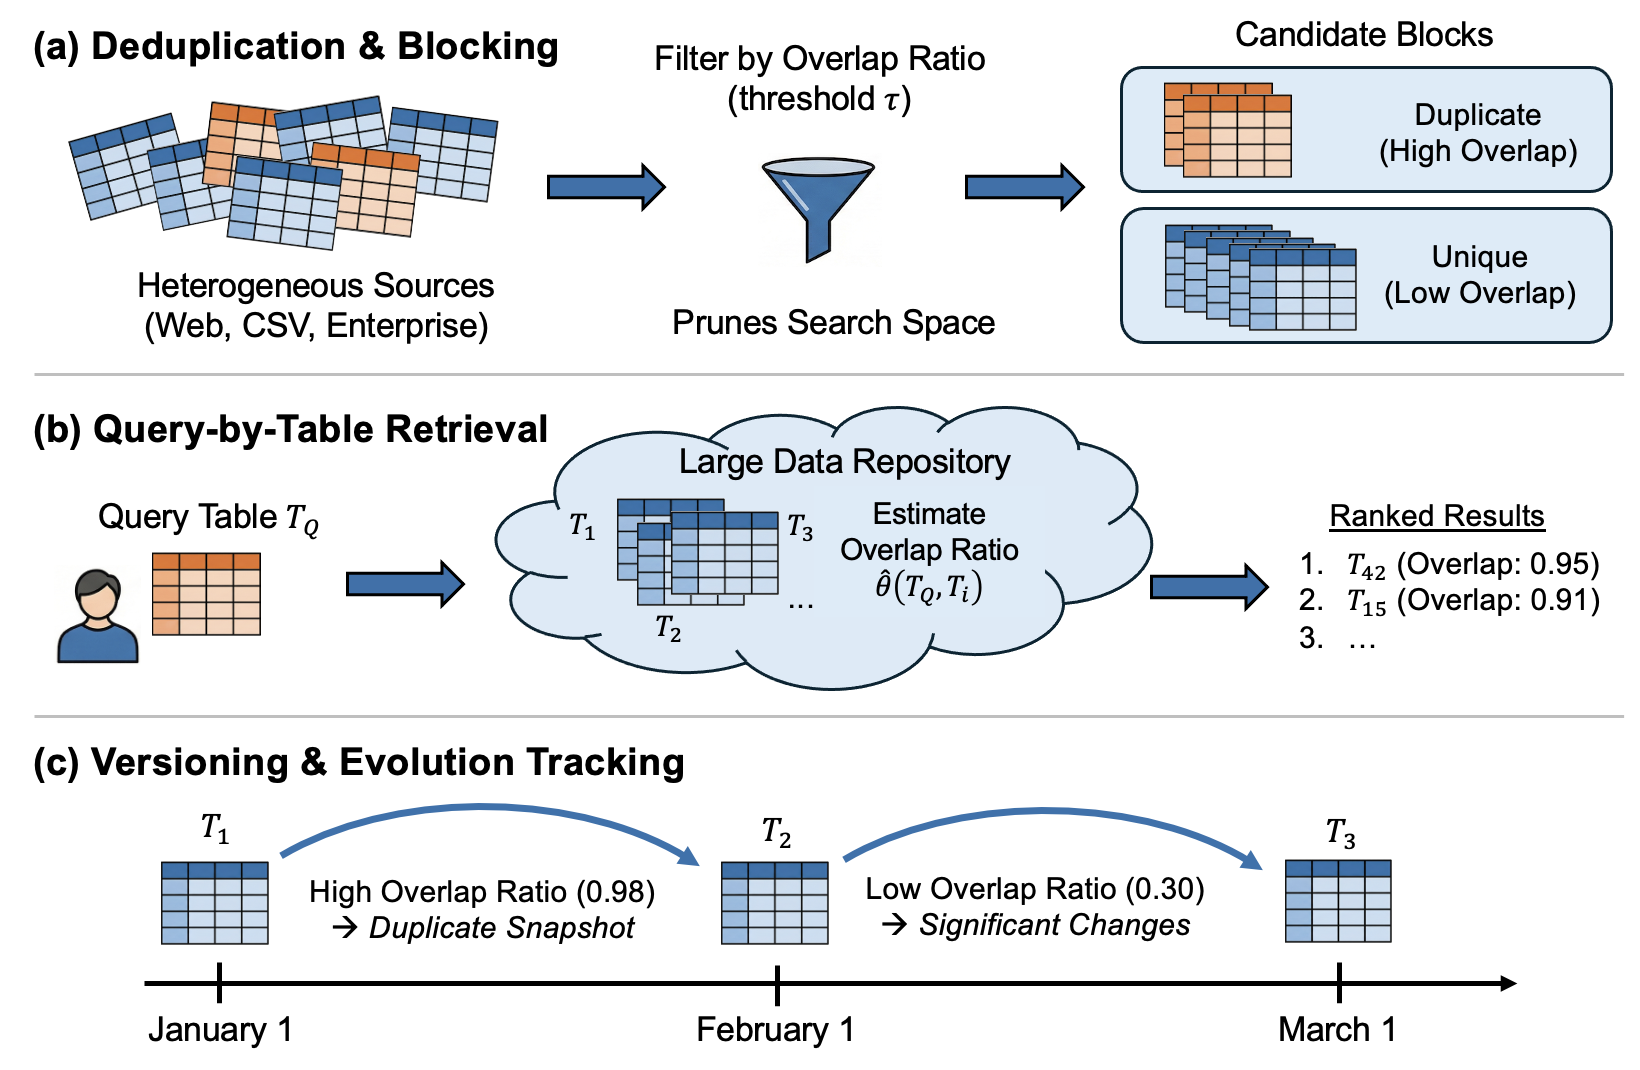
6.2) Alignment-Guided Largest Table Overlap Size Estimation (under review)
Alignment-Guided Largest Table Overlap Size Estimation targets fast estimation of how much two tables truly share, defined by the largest set of exactly matching cells obtainable after aligning subsets of rows and columns and normalizing by the smaller table. This becomes essential in large, messy repositories where headers may be missing or inconsistent and row or column order is unreliable, yet the estimate is needed to quickly screen candidates for downstream processing, support query-by-table retrieval, and track content changes across versions. Exact computation is combinatorial and expensive, and collecting new labels to retrain on every new corpus is often impractical in heterogeneous, shifting domains. The core contribution is an estimator designed to remain scalable and robust across repositories by making overlap depend on row–column structure and pair-specific correspondence signals, while reducing sensitivity to corpus-specific value distributions, without requiring costly alignment search at deployment time.
Topic 7: Missing Value Imputation
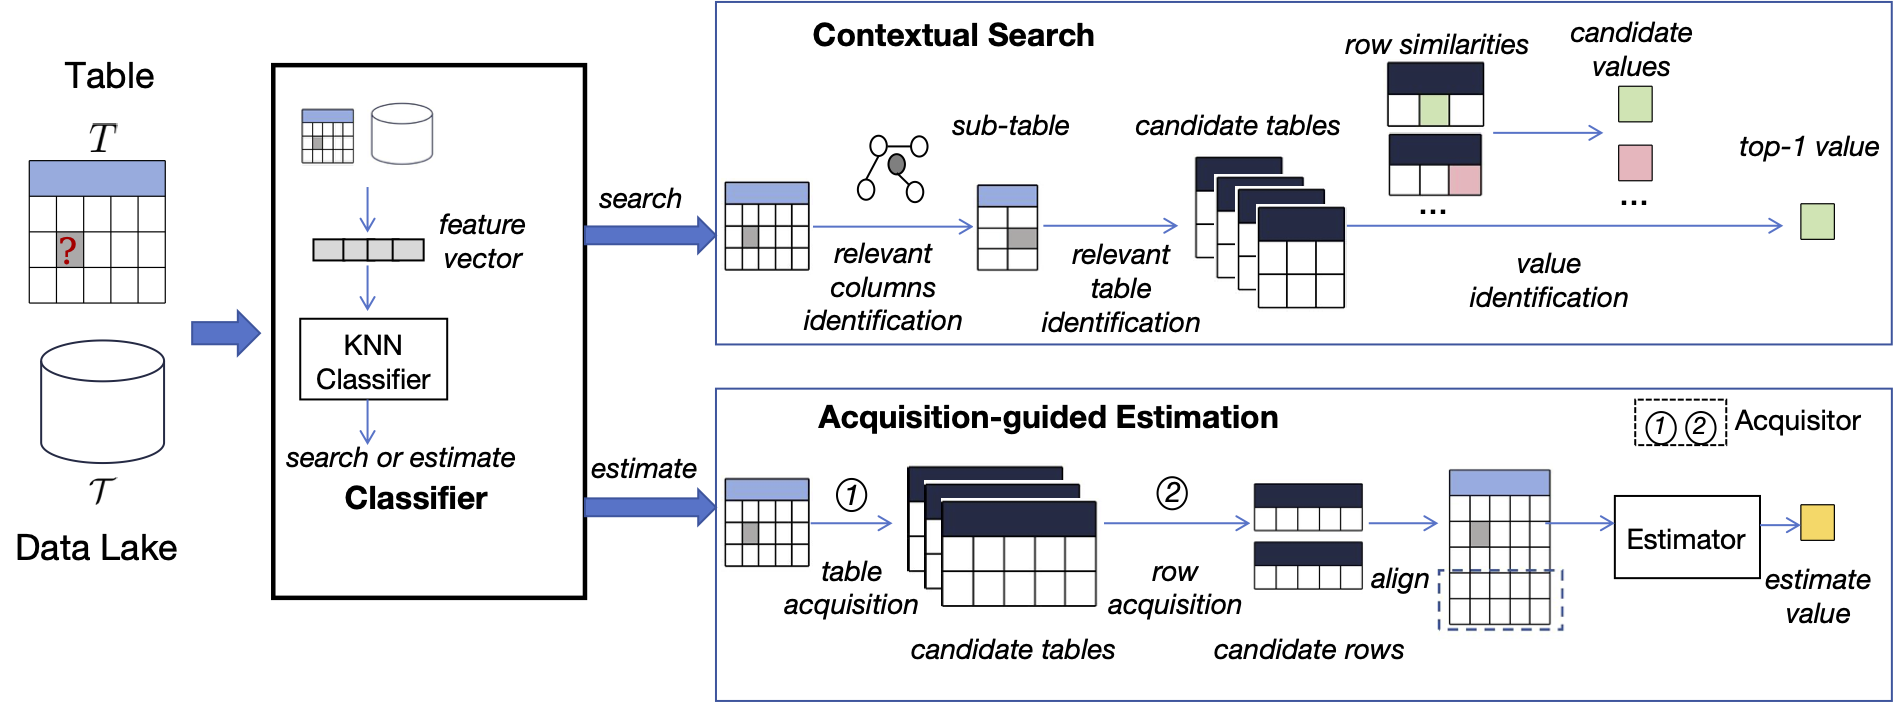
7.1) Missing Value Imputation in Tabular Data Lakes Unleashed: A Hybrid Approach (VLDBJ’26) (System Prototype)
Missing values in tabular data lakes can severely impact data analysis and diminish the performance in downstream applications. Ideally, a robust imputation strategy should properly take three aspects of variety into consideration: source of imputed value, the types of tables involved, and the data types of the missing value. However, the existing estimation-based or search-based imputation approaches do not effectively account for all three aspects of variety. To address this gap, we propose CESID, a hybrid method that effectively and efficiently combines the strengths of both search-based and estimation-based approaches, enabling its robustness in dealing with the three varieties. Extensive experiments conducted on three data lakes demonstrate that CESID effectively and efficiently addresses the missing value problem.
Topic 8: Cost-Effective QA
8.1) A Cost-Effective Framework for Complex Numerical QA over Semi-Structured Table (under review)
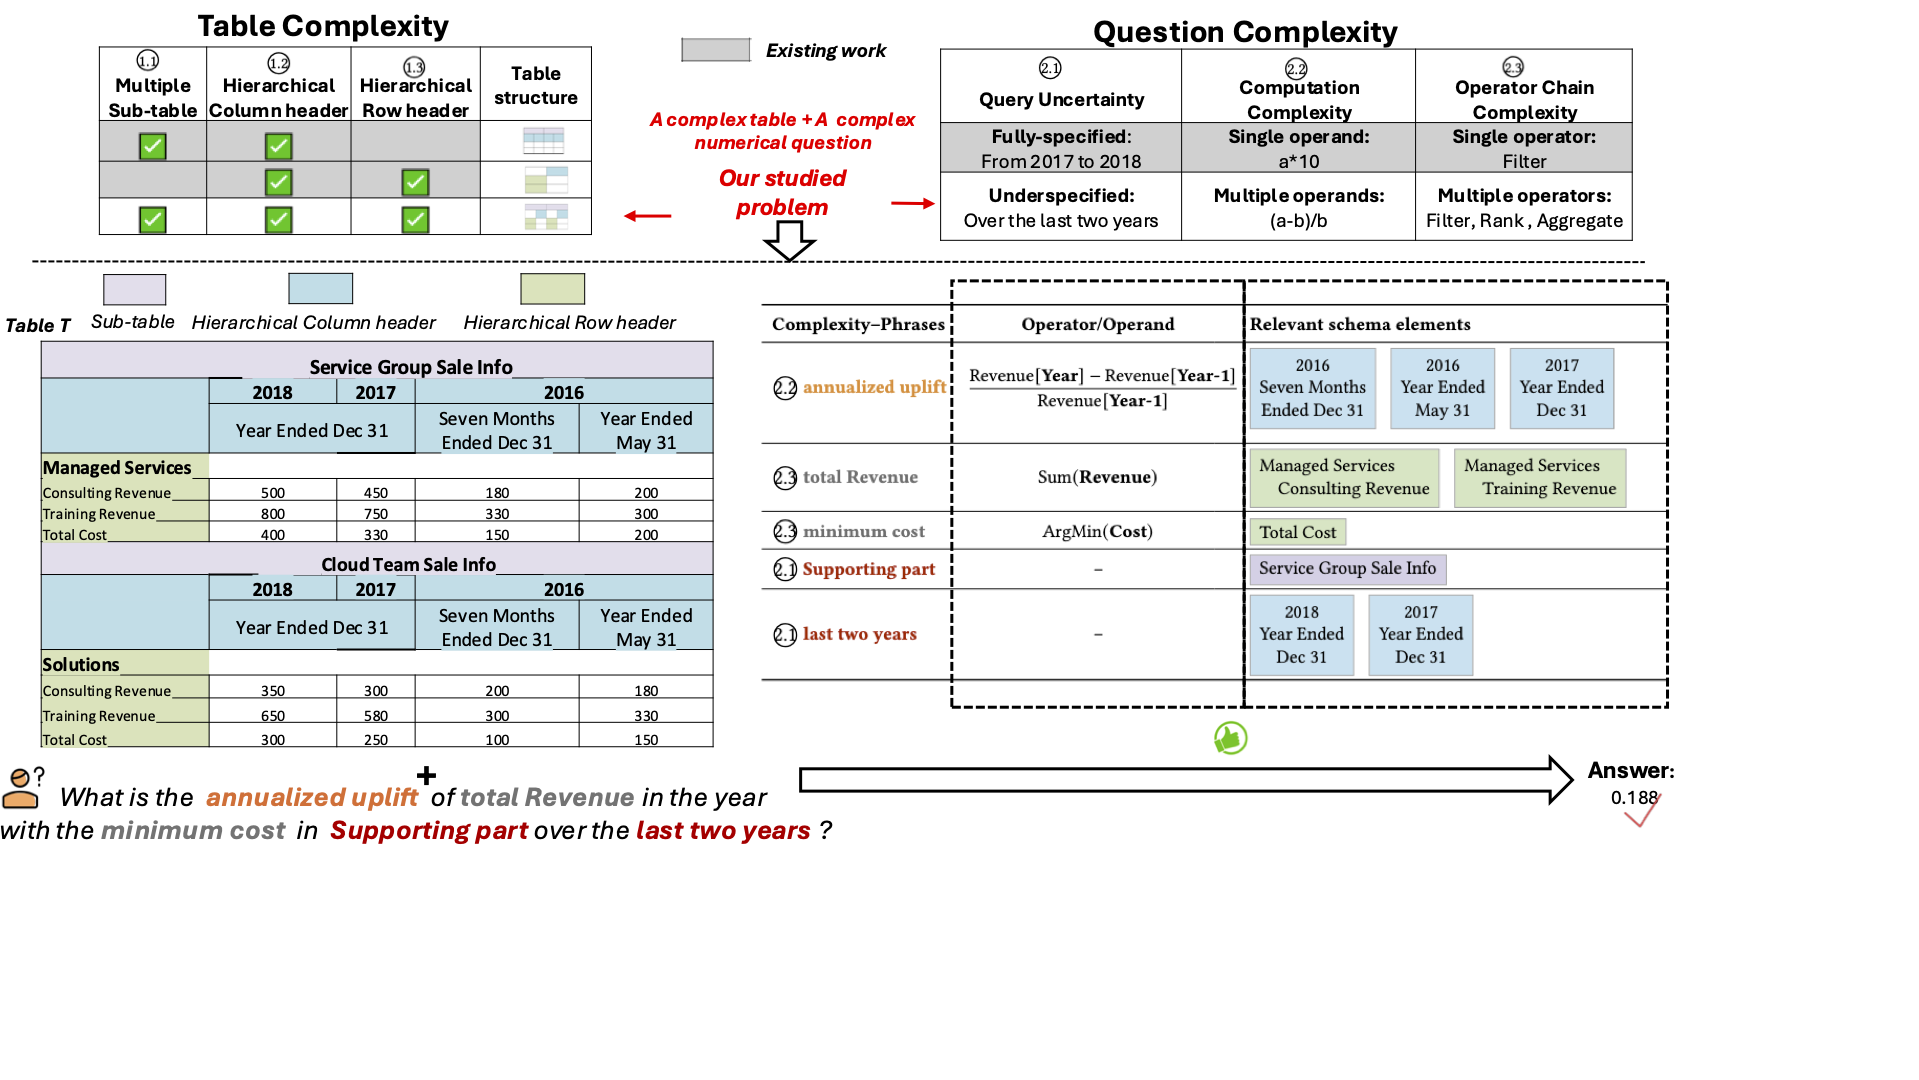
Semi-structured tables encode rich semantics through diverse schema elements, such as multiple subtables as well as hierarchical row and column headers. Answering numerical questions over such tables is challenging because table complexity and question complexity jointly require accurate table structure understanding, robust query uncertainty resolution, and support for complex analytic query intents. However, existing semi-structured table QA methods remain brittle in these complex settings, and typically rely on high-capability LLMs without accounting for monetary budgets. To address this gap, we propose SemiBonsai, a cost-effective framework for complex numerical QA over semi-structured table. Experiments on three benchmarks show that SemiBonsai consistently improves answer accuracy under both table-side and question-side complexity, while achieving stronger cost-effectiveness under fixed budgets.
8.2) Decomposition-Driven Multi-Table Retrieval and Reasoning for Numerical Question Answering (ICDE’26) (System Prototype)
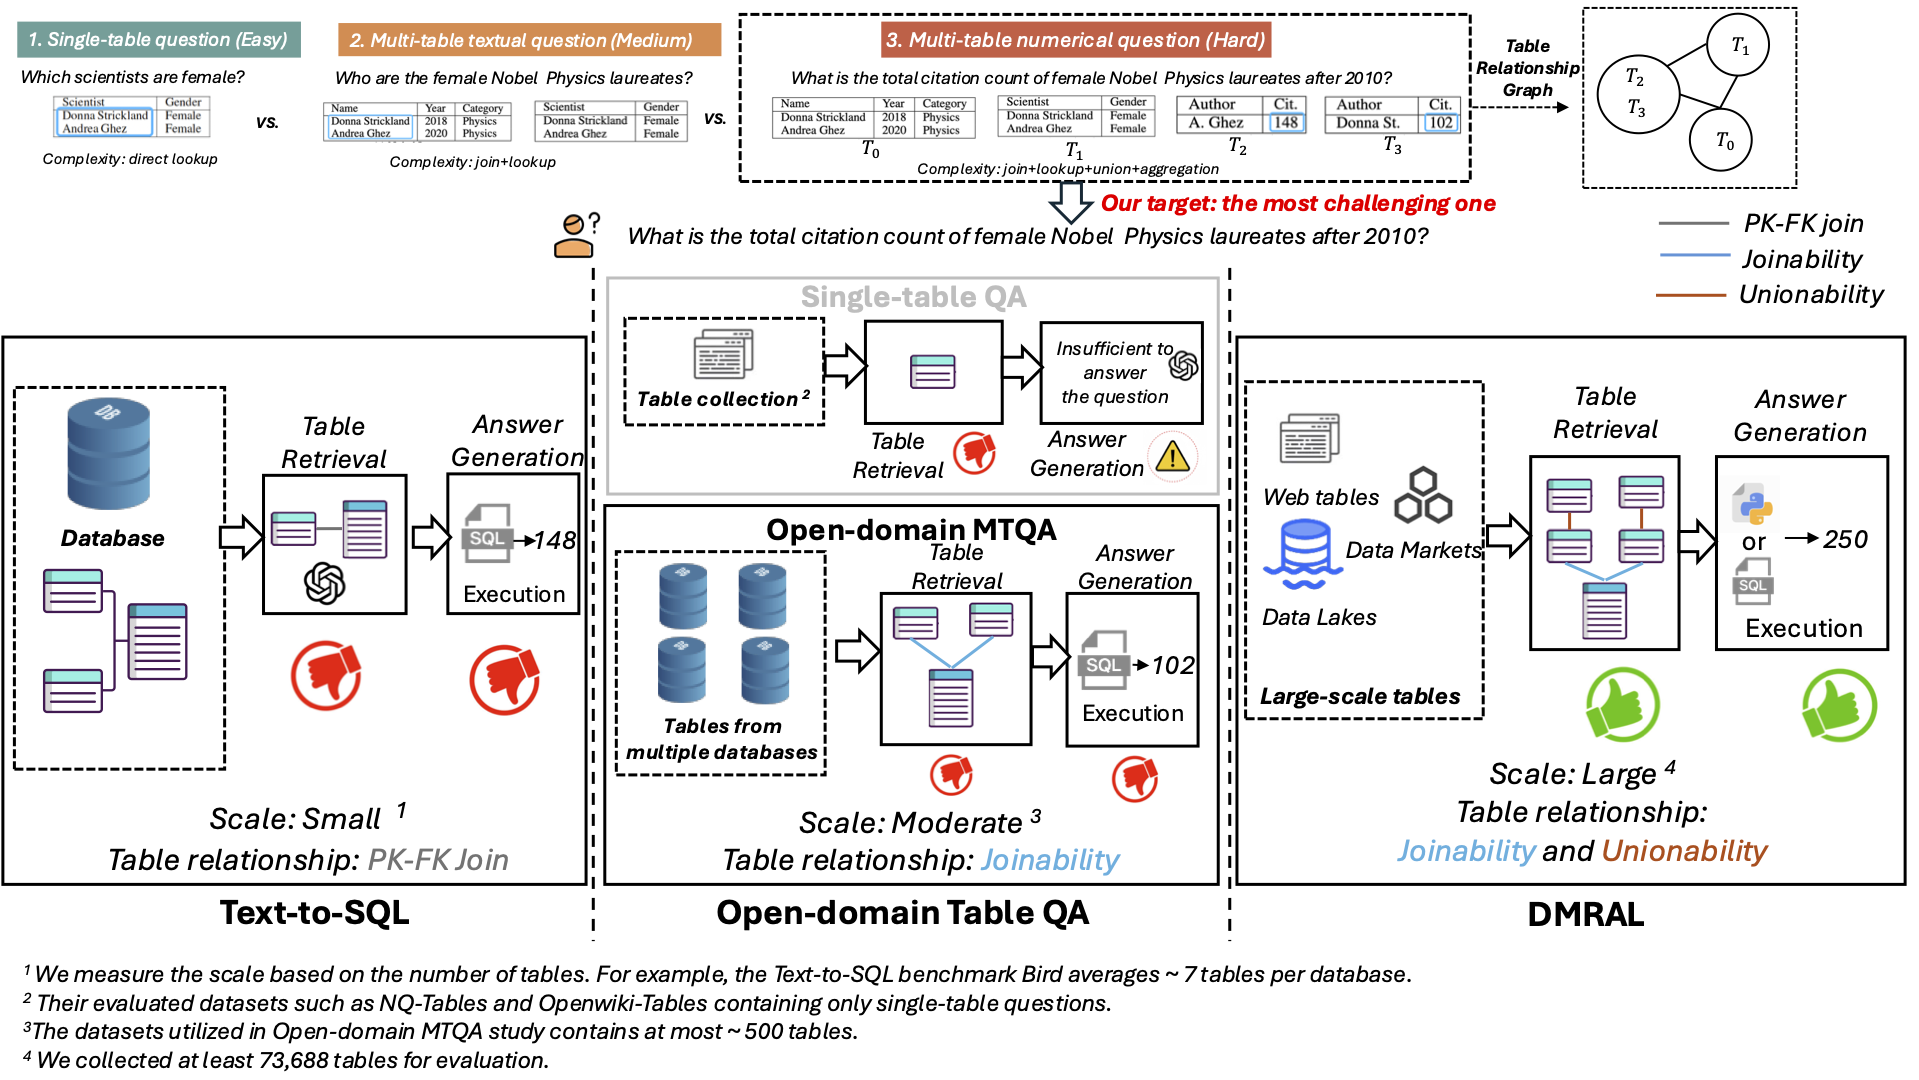
Answering numerical questions by identifying and integrating information from multiple tables in large-scale table collections is essential for many analytical applications. Existing MTQA solutions—such as text-to-SQL systems and open-domain MTQA methods—are designed for databases and often struggle when applied to large-scale table collections, due to their large scale, incomplete metadata, and complex inter-table relationships. To address this gap, we propose DMRAL, a Decomposition-driven multi-table Retrieval and Answering framework for MTQA over large-scale table collections. Experiments on two MTQA datasets demonstrate that DMRAL significantly outperforms existing state-of-the-art MTQA methods.
Topic 9: Visualization Exploration and Recommendation
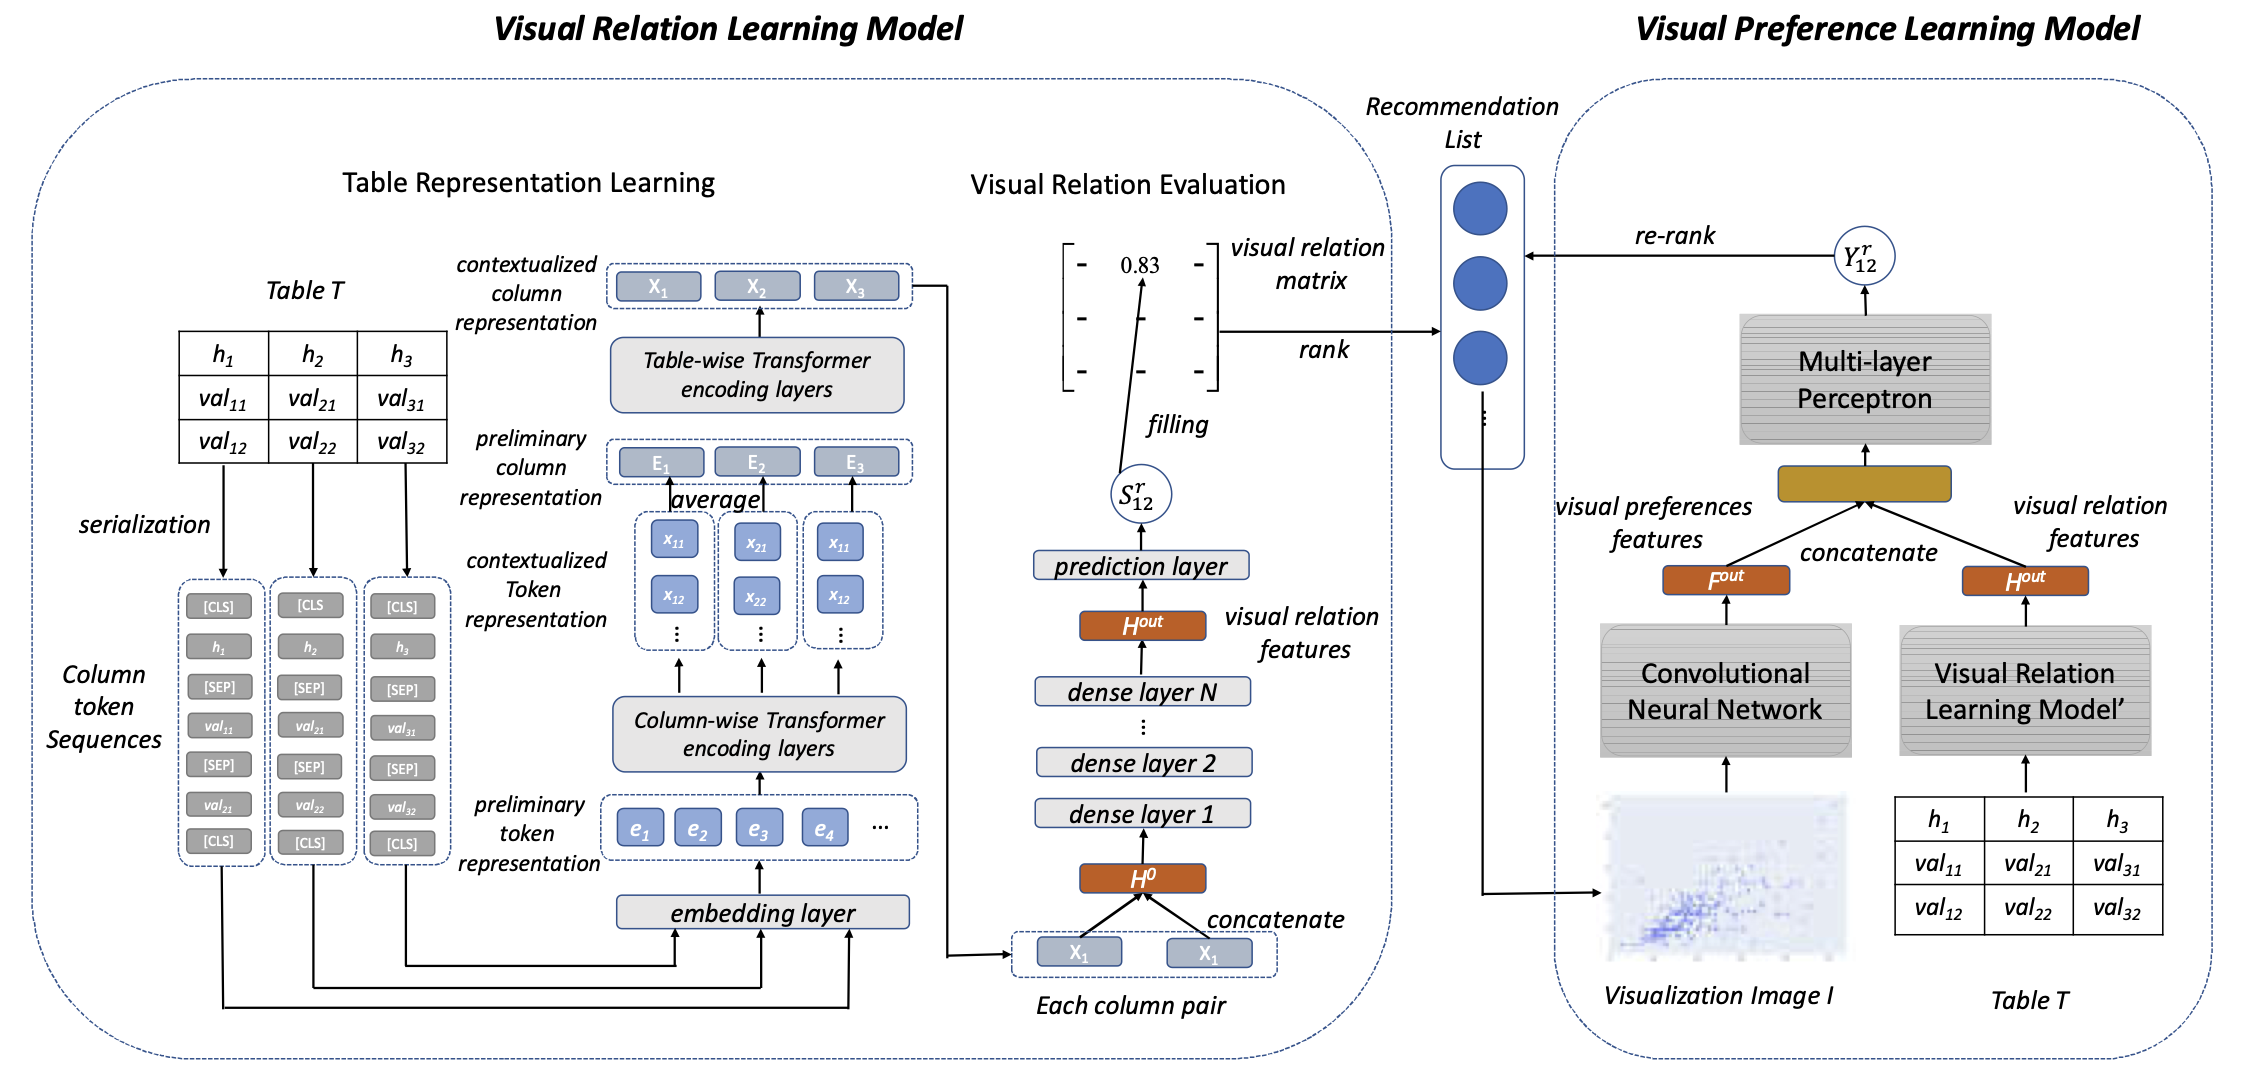
9.1) Visualization Recommendation Through Visual Relation Learning and Visual Preference Learning (ICDE’23) (System Prototype)
Visualization recommendation aims to automatically generate insightful and relevant visualizations for a given (tabular) dataset, helping novice users bypass the steep learning curves of complex visualization tools and the need for deep domain knowledge. In this work, we propose VisFormer, a novel machine learning-based method designed to act like a human data analyst by satisfying three essential properties: 1) Understanding the table content so that the system knows exactly what kind of information is contained in each column. 2) Capturing the column relations so that it can determine which variables naturally go together and how best to display them. 3) Detecting visual patterns to evaluate the generated charts and ensure they are visually coherent and intuitively meaningful.